






Apache Log Monitoring with ApacheTop
Web servers need regular monitoring to work well. If you manage Apache HTTP Server, you can track how it performs through its access logs. These logs show important details about server activity. However, reading through logs by hand takes too much time and effort. That’s why ApacheTop is so helpful. This tool watches Apache access logs as they update and shows the data in an easy-to-read display. In this blog, you’ll learn why ApacheTop is useful, how to set it up, and how to use its main features.
Why Monitor Apache Access Logs?
Before we dive into ApacheTop, let’s briefly discuss why monitoring Apache access logs is essential:
- Performance optimization: Identify bottlenecks and slow-loading resources
- Security: Detect unusual patterns or potential attacks
- Troubleshooting: Pinpoint issues related to specific requests or clients
- Capacity planning: Analyze traffic patterns to plan for future growth
- User behavior insights: Understand how visitors interact with your website
Installing ApacheTop
Before we thoroughly dive into the features, let’s take a look at the installation process. Generally speaking, ApacheTop comes pre-installed by default on most Linux distributions. However, if for some reason it’s not available on your system, then you can easily install it using your package manager.
For Ubuntu/Debian-based systems:
sudo apt-get install apachetopFor Red Hat/Fedora-based systems:
sudo yum install apachetop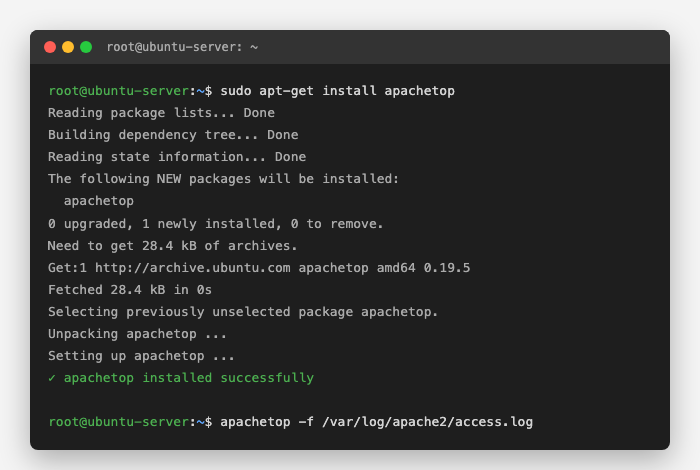
Understanding ApacheTop
ApacheTop is a command-line tool that provides a real-time, human-readable view of your Apache access logs. It showcases key information such as:
- Request rates
- Most frequently accessed URLs
- Client IP addresses
- HTTP status codes
- Response times
This information is updated in real-time, allowing you to monitor your server’s activity as it happens.
Flags and Parameters
ApacheTop offers several flags and parameters that help you customize its behavior. Here are some of the most commonly used ones:
-f : Specify the log file to monitor. You can use this flag multiple times to monitor multiple files. The default location for Apache server access logs is /var/log/httpd/access.log.
apachetop -f /var/logs/httpd/access.log-H : Set the maximum number of hits to remember. This flag is mutually exclusive with -T.
apachetop -f /etc/httpd/logs/access.log -H 2000-T : Set the maximum time period to remember hits. This flag is mutually exclusive with -H.
apachetop -f /etc/httpd/logs/access.log -T 30-q : Keep query strings in the output.
apachetop -f /etc/httpd/logs/access.log -q-l : Lowercase all URLs, treating /FOO and /foo as the same.
apachetop -f /etc/httpd/logs/access.log -l-s : Keep only the first segment parts of the path. Trailing slashes are kept if present.
apachetop -f /etc/httpd/logs/access.log -s 3-p : Keep the protocol (http:// usually) at the front of referrer strings.
apachetop -f /etc/httpd/logs/access.log -p-r : Set the default refresh delay in seconds.
apachetop -f /etc/httpd/logs/access.log -r 5Reading the Output
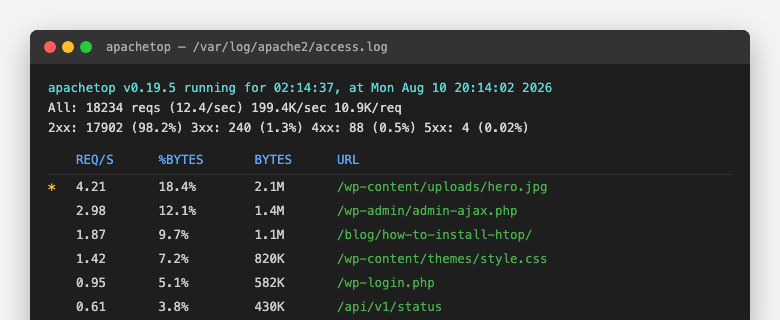
ApacheTop provides a real-time view of Apache web server activity, similar to how the ‘top’ command works for system processes. The screen is typically divided into two main sections. The top section displays summary statistics, while the bottom section shows more detailed information about specific requests.
In the summary section, you’ll typically find essential information such as the last hit time, how long ApacheTop has been running, and the current time. It also presents important metrics such as the total data transferred and requests per second, often broken down by HTTP status code categories (2xx, 3xx, 4xx, 5xx).
Below this summary, ApacheTop typically lists individual URLs, hosts, or referrers, showing the number of hits, request rates, and data transfer rates for each. This detailed view allows administrators to quickly identify which resources are being accessed most frequently and how much load they’re putting on the server.
The star (*) symbol next to the URL indicates which request is selected. You can scroll up and down using the Up and Down arrow keys to select different requests, then use the Right arrow key for the details page of that request, showing hosts and referrers. Use the Left arrow key to return to the main list.
You can also change the main view to show Hosts or Referrers instead of URLs, using the ‘d’ key.
Filters
ApacheTop makes it easy to filter what you see on screen. Press ‘f’ to open the filter menu, which shows three options: ‘add’, ‘clear’, and ‘show active’. To make a new filter, press ‘a’ first, then choose your filter type. You can filter by URL with ‘u’, by referrer with ‘r’, or by host with ‘h’.
After entering the specific criteria, ApacheTop will only display requests matching the selected filter. This feature allows administrators to focus on particular aspects of server activity, making it easier to monitor and analyze specific traffic patterns or issues within the Apache web server’s operation.
Conclusion
ApacheTop is a powerful tool for monitoring Apache access logs in real-time. With its various flags and parameters, you can customize the output to suit your needs. By following the instructions outlined in this blog, you can get started with using ApacheTop effectively and learn how to analyze your Apache server’s performance to ultimately achieve better performance.
Related reading: Check Server Load Average History