Check server load average history
This is a guide to know on how to check your current and past server load (cpu load) for debugging purpose.
System Activity Reporter (SAR) is an important tool which is used by the system admins for this in order to find out server load along with status of various metrics at different interval of time. You can run on centos based OS servers too.
You would need SSH access of the server in order to execute the given commands.
Command : sar -q
Sample Output :
[root@s15 ~]# sar -q
Linux 3.10.0-1062.4.2.vz7.116.7 (s15.basezap.com) 08/23/2021 _x86_64_ (4 CPU)
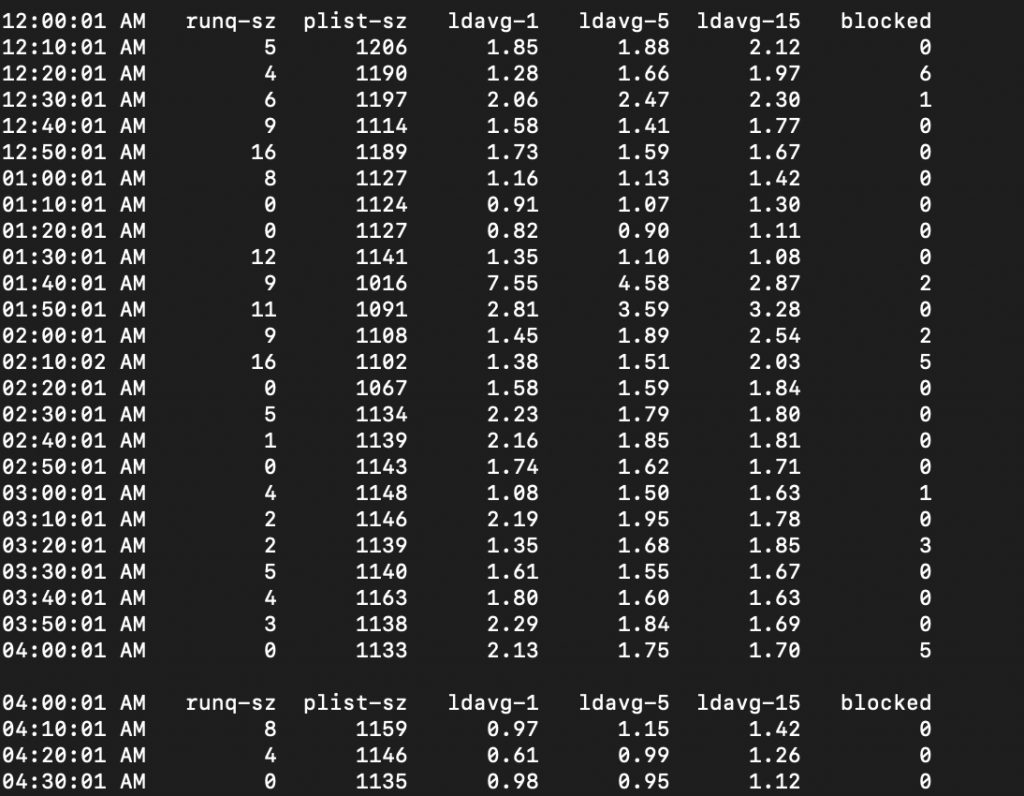
Here’s an explanation of the above different headings used:
“runq-sz” is the run queue length, which is the number of tasks waiting for run time.
“plist-sz” is the number of tasks in the task list.
“1davg-1” refers to the system load average over the last minute. The load average is calculated as the average number of runnable or running tasks (R state), and the number of tasks in uninterrupted sleep (D state) over the specified interval.
“ldavg-5” is the system load average for the past 5 minutes.
“ldavg-15” is thhe system load average for the past 15 minutes.
For memory utilisation , you can run the following command :
Command : sar -r
Sample output :
[root@s15 ~]# sar -r
Linux 3.10.0-1062.4.2.vz7.116.7 (s15.basezap.com) 08/23/2021 _x86_64_ (4 CPU)
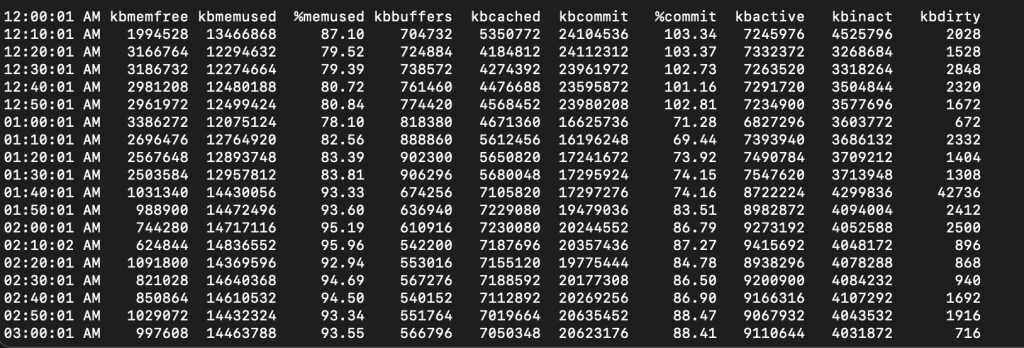
Here’s an n explanation of the above headings:
“kbmemfree” is the amount of free memory available in kilobytes.
“kbmemused is the amount of used memory in kilobytes, which does not take into account memory used by the kernel itself.
“%memused” is the percentage of used memory.
“kbbuffers” is the amount of memory used as buffers by the kernel in kilobytes.
“kbcached” is the amount of memory used to cache data by the kernel in kilobytes.
“kbcommit” is the amount of memory needed for the current workload in kilobytes. This is an estimate for how much RAM/swap is needed to make sure there is enough memory.
“%commit” is the percentage of memory needed for current workload related to the total amount of RAM + swap (equals memory). This percentage may be greater than 100 percent because the kernel usually over-commits memory.
Similarly for CPU utilization , you can use the following command :
Command : sar -u
Sample output :
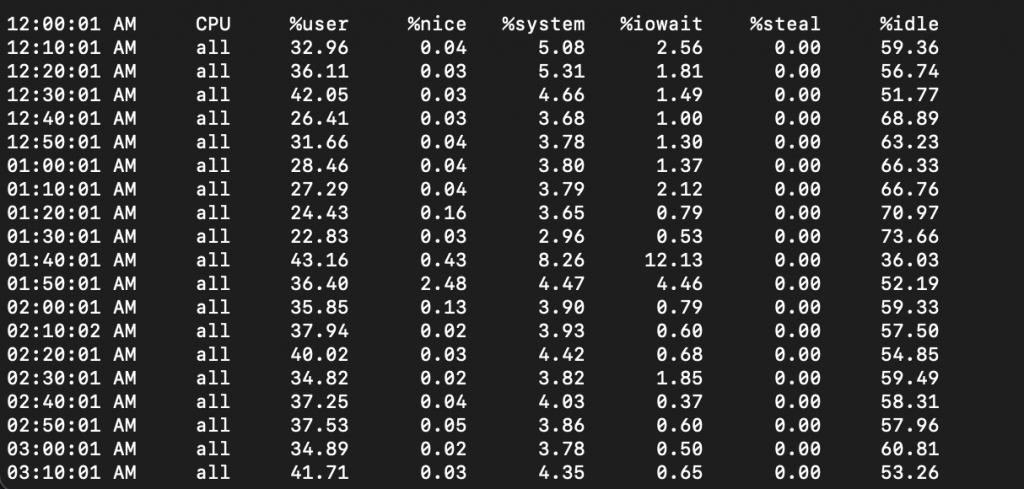
Here’s an explanation of the above variables:
“%user” is the percentage of CPU utilization that occurred while executing at the user level (application). This field includes time spent running virtual processors.
“%usr” is the percentage of CPU utilization that occurred while executing at the user level (application). This field does NOT include time spent running virtual processors.
“%nice” is the percentage of CPU utilization that occurred while executing at the user level with nice priority.
“%system” is the percentage of CPU utilization that occurred while executing at the system level (kernel). This field includes time spent servicing hardware and software interrupts.
“%sys” is the percentage of CPU utilization that occurred while executing at the system level (kernel). Note that this field does
NOT include time spent servicing hardware or software interrupts.
“%iowait” is the percentage of time that the CPU or CPUs were idle during which the system had an outstanding disk I/O request.
“%steal” is the percantage of time spent in involuntary wait by the virtual CPU or CPUs while the hypervisor was servicing another
virtual processor.